 SixOnFive
Stats
Box scores, season tables, shot charts, the player scorecard, exports, and what every column means.
- Box score for one game
- Season stats
- Shot charts, player scorecard and goalie card
- Print, PDF and Excel
- What the columns mean
Every stat is counted from the play-by-play, so fixing a play fixes every total it touches.
Box score for one game
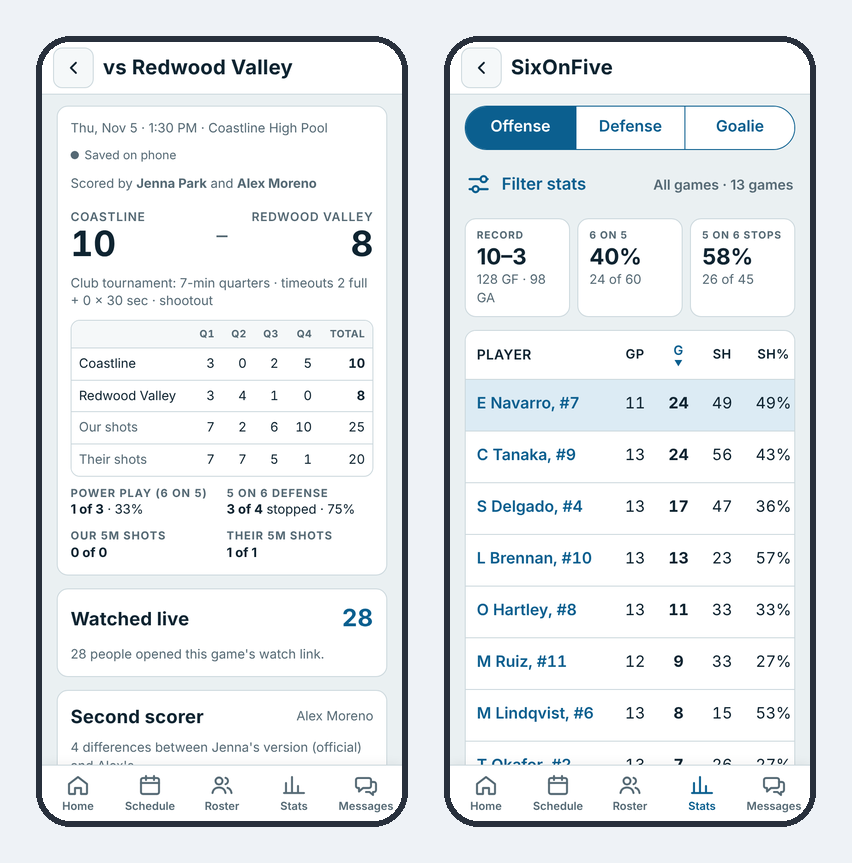
Tap any game in Results. The box score shows the score by quarter, shots by quarter, power play (6 on 5) and 5 on 6 defense, 5M shots, and every player's line. Below it is the full play-by-play. Coaches and Staff also see how many people watched live and who scored the game.
Season stats
The Stats tab totals every game. Switch between Offense, Defense and Goalie. Tap a column header to sort (tap again to reverse). The player column stays put while you scroll sideways.
Filter stats picks which games count: all games, one tournament, the last 5, or games you tick yourself. Scrimmages are left out unless you include them.
Shot charts, player scorecard and goalie card
Teams that track shot locations get extra charts on the Stats tab:
- Shot chart: every shot on the pool. Green dot = goal, red ring = saved, yellow × = missed.
- Player scorecard: pick a player for their best spots, habits, where misses go, shot types, cross-cage vs near-post goals, and a game-by-game trend. With fewer than 5 shots it shows faded as an early read.
- Goalie card: save percentage by spot on the cage, lobs and skips, and where shooters beat them from.
Print, PDF and Excel
- Game summary: print or save PDF on a finished game's box score.
- Season report: print or save PDF on the Stats tab.
- Excel export (Head Coach and Staff): season totals, each game's box score and the play-by-play, one sheet each. Opens in Excel, Numbers or Google Sheets.
What the columns mean
| Column | Meaning |
|---|---|
| GP | Games played |
| G | Goals |
| SH | Shots (goals + saved + missed, field blocks included) |
| SH% | Goals ÷ shots |
| AST | Assists |
| PTS | Points: goals + assists |
| PTS/G | Points per game |
| PP G | Power play goals (scored on a 6 on 5) |
| 5M G / 5M SH | 5-meter penalty goals / shots |
| STL | Total steals: steals + interceptions + ball unders drawn |
| INT | Interceptions |
| BU | Ball unders drawn |
| STL/G | Steals per game |
| BLK | Field blocks |
| EXD | Ejections drawn |
| 5M D | 5-meter penalties drawn |
| TOT EXD | Total ejections drawn (ejections + 5Ms drawn) |
| EX RAT | Ejection ratio: total drawn ÷ ejections and 5Ms committed |
| SPR W / SPR L | Sprints won / lost |
| TO | Total turnovers, every kind |
| OF | Offensive fouls |
| BUA | Ball unders against |
| BP | Bad passes |
| 2M | 2-meter offside |
| EXC | Ejections (excluded) |
| 5M C | 5-meter penalties committed |
| YC / RC | Yellow / red cards |
| SV | Saves |
| GA | Goals against |
| SV% | Saves ÷ (saves + goals against) |
| 5M SV / 5M GA | 5-meter saves / goals against |
Columns for things your team doesn't track are hidden.